Introduction
I often build small electronics projects for use around my home. I recently put together a small sensor interface that converts the inductance of a sensor to a digital signal with a frequency that is related to the inductance value. I want to send out a text message when the value of inductance exceeds a threshold level. Since this is a home project, I want to keep it simple and cheap. This blog post documents how I designed this circuit.
Background
The circuit I used is very slight variation on a charge pump circuit I saw years ago in the great little book called “Electronic Designer’s Handbook” by Thomas Hemingway (Figure 13.5). This little gem can be viewed online here. The only change I made to this circuit was to shift the voltage levels so that my input signal can be positive.
I will derive an expression for the input frequency-to-output voltage transfer function that is a bit more accurate than what Hemingway derives. However, this is his circuit and his book is still worth reading for those interested in transistor-level design. As you can see, this book was first published in 1966 and I still use it nearly fifty years later.
Analysis
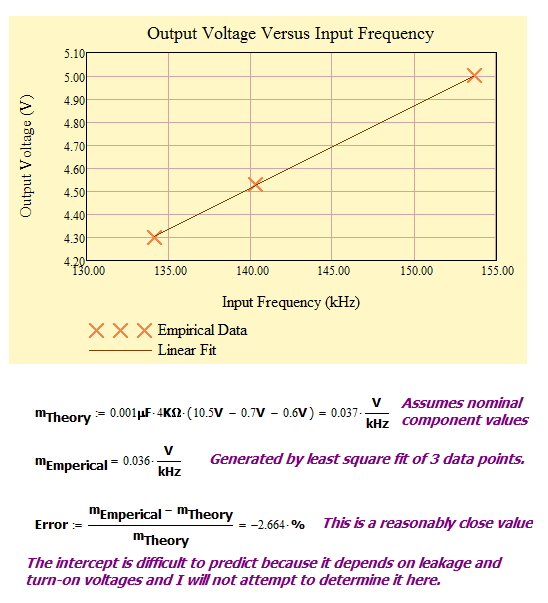
I will focus on my simulation results in this blog post section. Appendix A contains measured data from a working circuit in the field.
Schematic
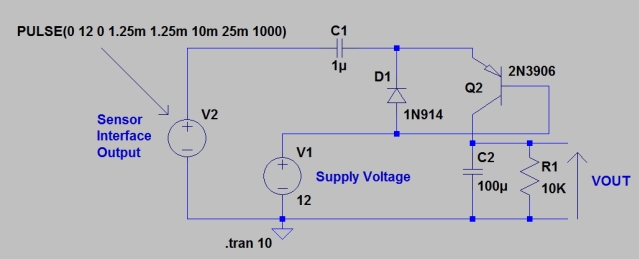
Figure 1 shows an LTSpice schematic of the circuit I put together.
Theory of Operation
Qualitative Description
The circuit operation is fairly straightforward.
- When the input signal goes low, C1 charges through D1.It is critical that C1 charge quickly relative to the period. This circuit depends on the transfer a fixed quantity of charge at the same rate as the input signal. This means that the charge transfer rate (i.e. current) is directly proportional to the input frequency.
- When the input signal goes high, C1 discharges through Q1 into C2.C2 will have enough capacitance to ensure that it changes little when C1 discharges into it. This will provide the filtering we need to for a smooth output voltage.
- The RC filter composed of R1 and C2.R is critical in determining the gain (i.e. slope) of the output voltage versus frequency curve. At equilibrium, the charge lost through R1 for each input cycle exactly equals the charge on C1.
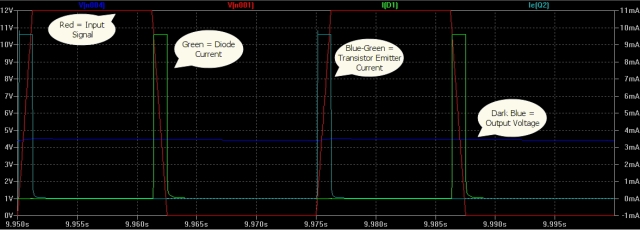
I included my simulation results below that clearly shows each of these operations occurring.
Mathematical Details
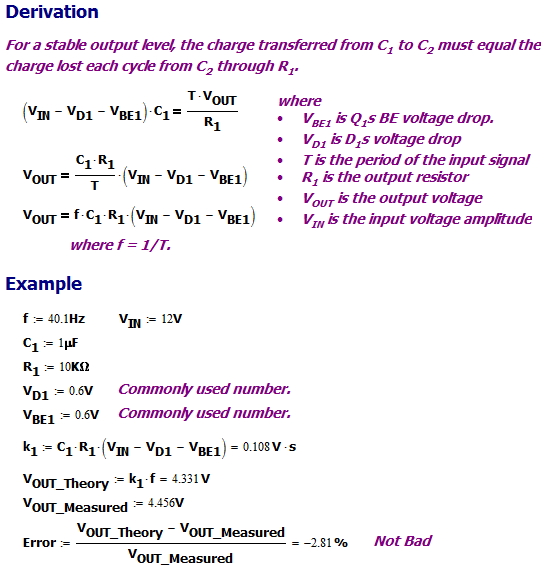
Figure 2 shows my derivation of a formula for the frequency-to-voltage conversion process.
Simulation Results
Single Simulation Result
Figure 3 shows my simulation results. To see these results clearly, you need to click on the image. The circuit operates exactly as described above.
Linearity Measurements
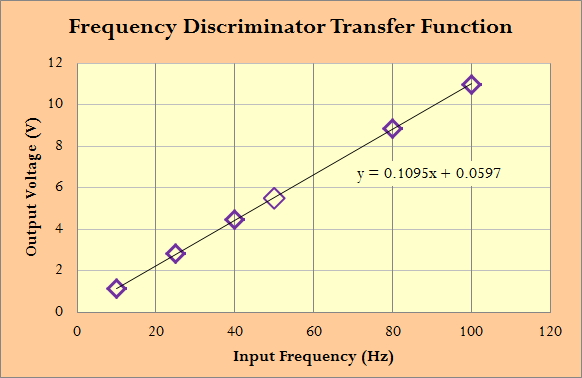
Figure 4 shows the linearity that I measured on the simulator. I predicted the slope of my voltage conversion to be 1.08 in Figure 2. My simulation shows 1.095, which means an error of ~1.4%. Not too bad.
Conclusion
This circuit is a critical part of a small home sensor system that I have put together. Here is a quick description of my sensor system.
- I built a metal sensor that is composed of a coil of wire (i.e. inductor) whose inductance decreases when a metal object comes near — the inductance decreases because of how currents are induced in the metal object.
- I built an oscillator which puts out a digital signal with a frequency that is proportional to the inductance of my wire coil.
- The circuit described here converts the digital signal’s frequency to a voltage level.
- I use a Schmitt trigger to generate an alarm when the voltage from my frequency-to-voltage converter exceeds a value that I have set.
Appendix A: Some Empirical Data from a Circuit I Built
Figure 5 shows 3 data points from a version of this circuit that I am using for a home project. This particular application had C1 = 0.001 µF and R1 = 4 kΩ. You can see that the response is quite linear, the measured and predicted slopes were within experimental error, and it is working well in my application.

