Math Encounters Blog
I stumbled upon some math today …
Skip to content
Home
About
←
Outdoor Enclosure Temperature Profile Math
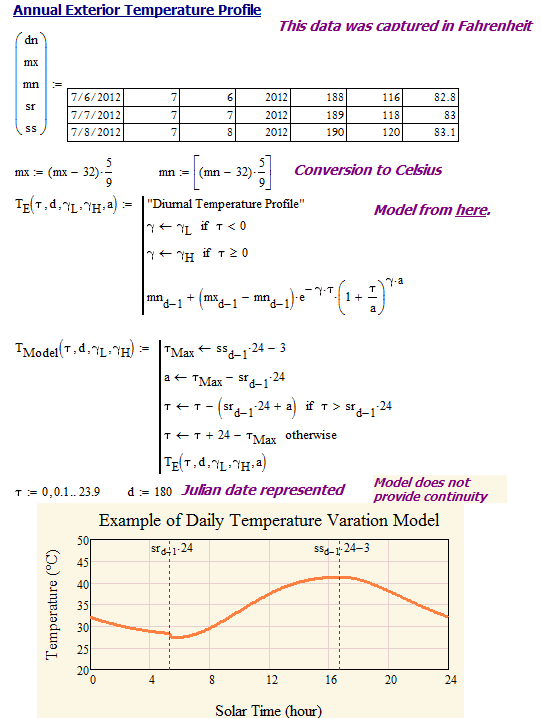
Figure 2: Model of Daily Temperature Variation.
By
mathscinotes
|
Published
December 9, 2012
|
Full size is
541 × 718
pixels
Figure 3: Model of Enclosure Temperaure Rise due to Solar Load in Phoenix.
CombinedModel
Figure 2: Model of Daily Temperature Variation.
Bookmark the
permalink
.
Leave a comment
Cancel reply
Δ
Comment
Subscribe
Subscribed
Math Encounters Blog
Sign me up
Already have a WordPress.com account?
Log in now.
Math Encounters Blog
Customize
Subscribe
Subscribed
Sign up
Log in
Copy shortlink
Report this content
View post in Reader
Manage subscriptions
Collapse this bar

